Introducing Insight Reports – Feature update Oct’16
Recently we’ve brought you the whole new level of reporting with help of Insights visuals in bar charts with filters and many more. Simple and best is what our concern and we’ve keep it simple and powerful.
What are Insight Reports?
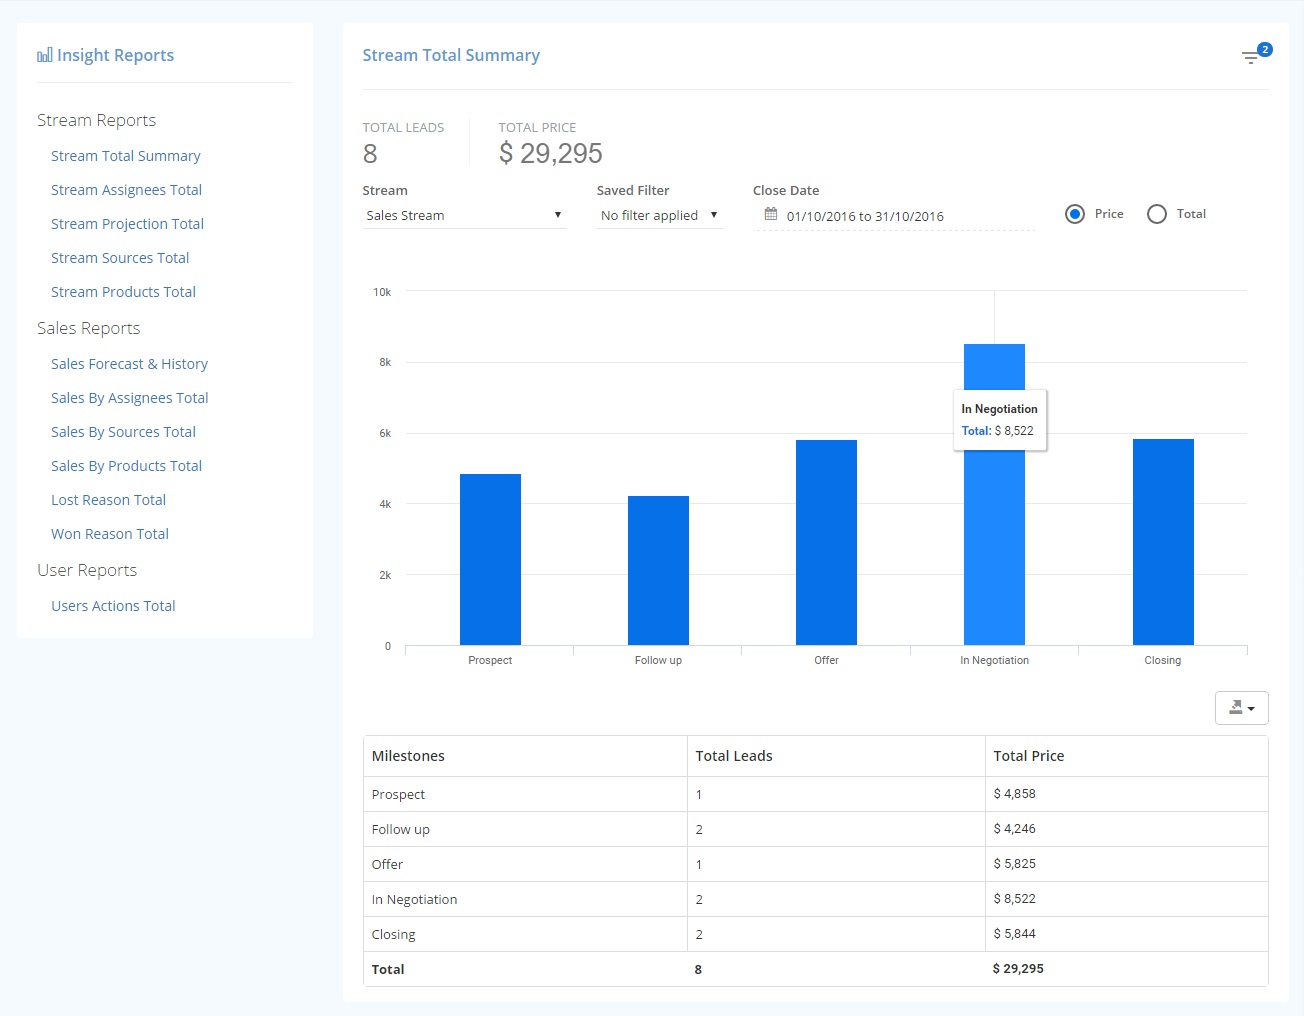
New reports with bar charts with filters, table and exports in Excel, CSV or Word. Gives lot more insights on your streams, leads and users at one place with beautiful graphical representation.
Stream Reports
These reports includes and are based on milestones of selected stream and can be seen visually on chart.
- Stream Total Summary: Shows total of leads in stream milestones demonstrates in bar chart either by Price or Total, also in below table. Total or Price – Y, all milestones names – X.
- Stream Assignee Total: Shows total of leads in stream milestones stacked on assigned users wise representing in bar chart either by Price or Total, also in below table. Price or Total – X, all assignee names – Y.
- Stream Projection Total: Shows total of leads in stream milestones stacked on daily, weekly, monthly and quarterly wise representing in bar chart either by Price or Total, also in below table. Price or Total – Y, all periods found – X.
- Stream Sources Total: Shows total of leads in stream milestones stacked on sources wise representing in bar chart either by Price or Total, also in below table. Price or Total – X, all sources names – Y.
- Stream Products Total: Shows total leads in stream milestones stacked on products wise representing in bar chart either by Price or Total, also in below table. Price or Total – X, all products names – Y.
Sales Reports
These reports includes and are based on lead statuses and can be seen visually on chart.
- Sales Forecast & History: Shows total of leads in stream with lead statuses stacked on daily, weekly, monthly or quarterly wise in bar chart either by Price or Total, also in below table. Total or Price – Y, all periods names – X.
- Sales By Assignee Total: Shows total of leads in stream with lead statuses stacked on assignee representing in bar chart either by Price or Total, also in below table. Total or Price – X, all users names – Y.
- Sales By Sources Total: Shows total of leads in stream with lead statuses stacked on sources representing in bar chart either by Price or Total, also in below table. Total or Price – X, all sources names – Y.
- Sales By Sources Total: Shows total of leads in stream with lead statuses stacked on products representing in bar chart either by Price or Total, also in below table. Total or Price – X, all products names – Y.
- Lost Reasons Total: Shows total of leads in stream with lost status only of lost reasons representing in bar chart either by Price or Total, also in below table. Total or Price – X, all lost reasons names – Y.
- Won Reasons Total: Shows total of leads in stream with won status only of won reasons representing in bar chart either by Price or Total, also in below table. Total or Price – X, all won reasons names – Y.
User Reports
- Users Actions Total: Shows total of actions counted by users within selected logged date range representing in bar chart also in table. Totals – X, all users names – Y.
What type of information can I get from Insight Reports?
- Get a sum for your all leads at one go
- See how your forecast and current sales are trending compared to previous time periods
- Easily compare yourself to the team average and top performer
See your stream by milestone so you can identify bottlenecks or load balance - See your sales history by average leads, average sales per time period (day, week, month, or quarter)
Some points to note:
- Stream reports and Sales reports depends up on Lead Expected Close date which should be entered for a default report to work.
- Close date is optional for filtering the result but is essential for stream Projection and all Sales reports
If you have more questions about using Leadxen Insight Reports, comment below or contact us.